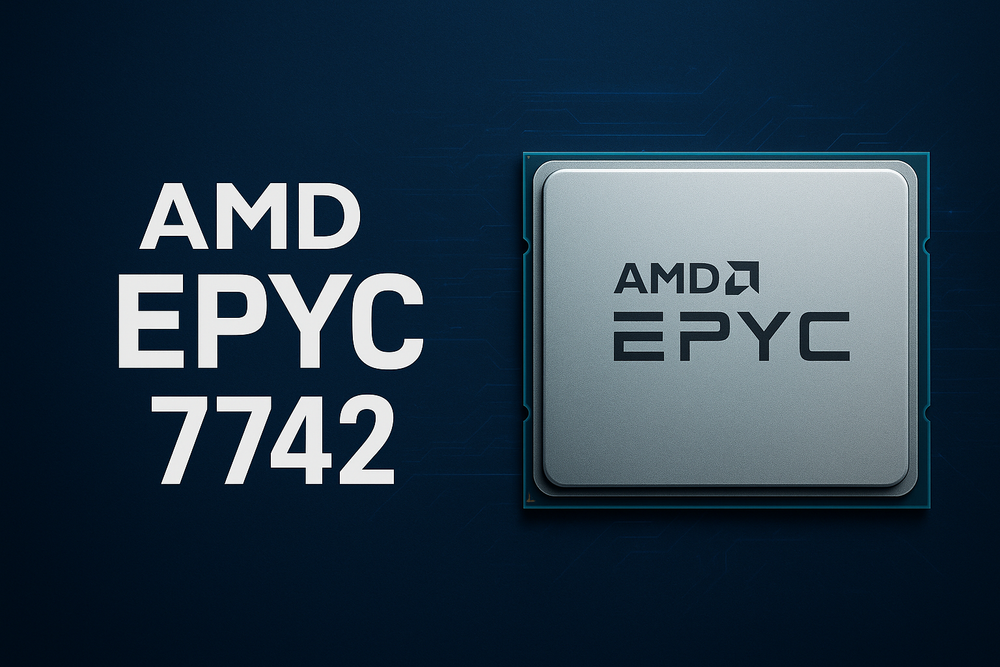
AMD EPYC 7742 | Benchmarking 基准测试
First | 序
AMD EPYC 7742 是一款旗舰级服务器处理器
属于第二代EPYC(霄龙)7002 系列,采用7nm 工艺和 Zen 2 架构
核心与线程:它拥有 64个核心 和 128个线程。
- 频率:
- 基础频率为 2.25 GHz。
- 最大加速频率可达 3.40 GHz。
- 功耗 (TDP):额定热设计功耗 (TDP) 为 225W。
- 缓存:配备了 256 MB 的 L3 缓存。
- 内存:
- 支持 8个 DDR 内存通道。
- 每个插槽的最大 DDR 频率为 3200 MHz。
- 理论内存带宽达到 204.8 GB/s。
- PCIe® Gen 4 通道:支持 128个 PCIe® Gen 4 通道 (适用于2P/1P配置)
接下来进行一些基准测试
计划分为两部分
- PerformanceTest
- Phoronix Test Suite
测试环境
-
硬件信息
════════════════════════════════════════════════════════════════════════════════ System Hardware Information Report ════════════════════════════════════════════════════════════════════════════════ ┌─ System Information ├──────────────────── │ Hostname : LHR │ Operating System : openSUSE Tumbleweed │ Kernel Version : 6.16.3-1-default │ System Uptime : 22:19 └────────────────────────────────────────────────── ┌─ CPU Information ├───────────────── │ Model : AMD EPYC 7742 64-Core Processor │ Cores : 64 │ Threads : 128 │ Frequency : 3382.752 MHz │ Cache : 512 KB │ Usage : 0.0% └────────────────────────────────────────────────── ┌─ Memory (RAM) Information ├────────────────────────── │ Total : 1007.46 GB │ Used : 9.8Gi │ Available : 997.64 GB │ │ Memory Modules: ├────────────────────────────────────────────────────────────────────────────────────────────────────┤ │ Size │ Type │ Frequency │ Manufacturer │ Serial Number │ Model │ ├────────────────────────────────────────────────────────────────────────────────────────────────────┤ │ 64 GB │ DDR4 │ 2666 MT/s │ 802C8632802C │ 20A7B5A7 │ 72ASS8G72LZ-2G6D2 │ │ 64 GB │ DDR4 │ 2666 MT/s │ 802C8632802C │ 1FF8E668 │ 72ASS8G72LZ-2G6D2 │ │ 64 GB │ DDR4 │ 2666 MT/s │ 802C8632802C │ 20068DA3 │ 72ASS8G72LZ-2G6D2 │ │ 64 GB │ DDR4 │ 2666 MT/s │ 802C8632802C │ 20068A77 │ 72ASS8G72LZ-2G6D2 │ │ 64 GB │ DDR4 │ 2666 MT/s │ 802C8632802C │ 208DD3A6 │ 72ASS8G72LZ-2G6D2 │ │ 64 GB │ DDR4 │ 2666 MT/s │ 802C80B3802C │ 20B23180 │ 72ASS8G72LZ-2G6D2 │ │ 64 GB │ DDR4 │ 2666 MT/s │ 802C8632802C │ 2006A00E │ 72ASS8G72LZ-2G6D2 │ │ 64 GB │ DDR4 │ 2666 MT/s │ 802C8632802C │ 20069007 │ 72ASS8G72LZ-2G6D2 │ │ 64 GB │ DDR4 │ 2666 MT/s │ 802C8632802C │ 20069FFD │ 72ASS8G72LZ-2G6D2 │ │ 64 GB │ DDR4 │ 2666 MT/s │ 802C80B3802C │ 20BD2489 │ 72ASS8G72LZ-2G6D2 │ │ 64 GB │ DDR4 │ 2666 MT/s │ 802C8632802C │ 20A5FF37 │ 72ASS8G72LZ-2G6D2 │ │ 64 GB │ DDR4 │ 2666 MT/s │ 802C8632802C │ 20AB185A │ 72ASS8G72LZ-2G6D2 │ │ 64 GB │ DDR4 │ 2666 MT/s │ 802C80B3802C │ 20B231F3 │ 72ASS8G72LZ-2G6D2 │ │ 64 GB │ DDR4 │ 2666 MT/s │ 802C80B3802C │ 20BD402C │ 72ASS8G72LZ-2G6D2 │ │ 64 GB │ DDR4 │ 2666 MT/s │ 802C8632802C │ 20069F07 │ 72ASS8G72LZ-2G6D2 │ │ 64 GB │ DDR4 │ 2666 MT/s │ 802C8632802C │ 2006A309 │ 72ASS8G72LZ-2G6D2 │ └────────────────────────────────────────────────────────────────────────────────────────────────────┘ └────────────────────────────────────────────────── ┌─ Disk Drive Information ├──────────────────────── │ /dev/nvme0n1p3 1.8T 368G 1.4T 21% / │ /dev/nvme0n1p3 1.8T 368G 1.4T 21% /.snapshots │ /dev/nvme0n1p3 1.8T 368G 1.4T 21% /boot/grub2/i386-pc │ /dev/nvme0n1p3 1.8T 368G 1.4T 21% /boot/grub2/x86_64-efi │ /dev/nvme0n1p3 1.8T 368G 1.4T 21% /home │ /dev/nvme0n1p3 1.8T 368G 1.4T 21% /opt │ /dev/nvme0n1p3 1.8T 368G 1.4T 21% /root │ /dev/nvme0n1p3 1.8T 368G 1.4T 21% /srv │ /dev/nvme0n1p3 1.8T 368G 1.4T 21% /usr/local │ /dev/nvme0n1p3 1.8T 368G 1.4T 21% /var │ /dev/nvme0n1p1 1.1G 7.6M 1.1G 1% /boot/efi │ /dev/ram0 20G 2.1M 19G 1% /mnt/ram0 │ │ Physical Disks Details: │ │ ═══ /dev/nvme0n1 ═══ │ Basic Info: 1.7T Dell Ent NVMe P5500 RI U.2 1.92TB │ SMART Status: PASSED │ Power On Hours: 2,139 hours │ Data Transfer Statistics: │ Total Reads: 1.24 TB │ Total Writes: 10.13 TB │ Temperature: 31°C │ Percentage Used: 0% │ Available Spare: 100% │ Critical Warning: 0x00 │ Health Status: 100% └────────────────────────────────────────────────── ┌─ RAID Controller Information ├───────────────────────────── │ Status : Not detected └────────────────────────────────────────────────── ┌─ Network Interface Information ├─────────────────────────────── │ │ ═══ em1 ═══ │ Model: Broadcom Inc. and subsidiaries NetXtreme BCM5720 Gigabit Ethernet PCIe │ Status: DOWN │ MAC Address: f4:02:70:XX:XX:XX │ Duplex: unknown │ Link Detected: No │ RX: 0 GB │ TX: 0 GB │ │ ═══ em2 ═══ │ Model: Broadcom Inc. and subsidiaries NetXtreme BCM5720 Gigabit Ethernet PCIe │ Status: DOWN │ MAC Address: f4:02:70:XX:XX:XX │ Duplex: unknown │ Link Detected: No │ RX: 0 GB │ TX: 0 GB │ │ ═══ p1p1 ═══ │ Model: Mellanox Technologies MT27710 Family [ConnectX-4 Lx] │ Status: UP │ IPv4: XX.XX.XX.XX/31 │ IPv6: fe80::XX:XX::/64 │ MAC Address: 0c:42:a1:XX:XX:XX │ Speed: 25000 Mbps │ Duplex: full │ Link Detected: Yes │ RX: 68.47 GB │ TX: 45.97 GB └────────────────────────────────────────────────── ┌─ Graphics Card Information ├─────────────────────────── │ │ Graphics Cards (PCI): │ 82:00.0 Non-Volatile memory controller: Intel Corporation NVMe DC SSD [3DNAND, Sentinel Rock Controller] │ c3:00.0 VGA compatible controller: Matrox Electronics Systems Ltd. Integrated Matrox G200eW3 Graphics Controller (rev 04) │ │ Display Hardware Summary: │ ================================================================ │ /0/120/5.2/0/0 display Integrated Matrox G200eW3 Graphics Controller └────────────────────────────────────────────────── ┌─ Motherboard Information ├───────────────────────── │ Vendor : Dell Inc. │ Model : 04F3CJ │ Version : A02 │ BIOS Vendor : Dell Inc. │ BIOS Version : 2.19.0 └────────────────────────────────────────────────── -
软件信息
-
phoronix-test-suite
- Version : 10.8.4-4.5
-
PerformanceTest
- Linux (11.0.1002)
-
OS
- openSUSE Tumbleweed VERSION="20250904"
-
1. PerformanceTest
1.1. 64 Threads
                   PassMark PerformanceTest Linux (11.0.1002)


AMD EPYC 7742 64-Core Processor (x86_64)
64 cores @ 0 MHz  |  1007.5 GiB RAM
Number of Processes: 64  |  Test Iterations: 5  |  Test Duration: Long
--------------------------------------------------------------------------------
CPU Mark:                          72029
  Integer Math                     311887 Million Operations/s
  Floating Point Math              228370 Million Operations/s
  Prime Numbers                    1010 Million Primes/s
  Sorting                          160233 Thousand Strings/s
  Encryption                       75680 MB/s
  Compression                      1274399 KB/s
  CPU Single Threaded              2210 Million Operations/s
  Physics                          10667 Frames/s
  Extended Instructions (SSE)      92100 Million Matrices/s

Memory Mark:                       3130
  Database Operations              23782 Thousand Operations/s
  Memory Read Cached               25612 MB/s
  Memory Read Uncached             14134 MB/s
  Memory Write                     12916 MB/s
  Available RAM                    1026975 Megabytes
  Memory Latency                   47 Nanoseconds
  Memory Threaded                  134074 MB/s
--------------------------------------------------------------------------------
1.2. 128 Threads
                   PassMark PerformanceTest Linux (11.0.1002)


AMD EPYC 7742 64-Core Processor (x86_64)
64 cores @ 3416 MHz  |  1007.4 GiB RAM
Number of Processes: 128  |  Test Iterations: 5  |  Test Duration: Long
--------------------------------------------------------------------------------
CPU Mark:                          78469
  Integer Math                     447506 Million Operations/s
  Floating Point Math              263739 Million Operations/s
  Prime Numbers                    589 Million Primes/s
  Sorting                          188373 Thousand Strings/s
  Encryption                       127152 MB/s
  Compression                      1673200 KB/s
  CPU Single Threaded              2217 Million Operations/s
  Physics                          6537 Frames/s
  Extended Instructions (SSE)      91182 Million Matrices/s

Memory Mark:                       3120
  Database Operations              23556 Thousand Operations/s
  Memory Read Cached               25664 MB/s
  Memory Read Uncached             14119 MB/s
  Memory Write                     12720 MB/s
  Available RAM                    1028177 Megabytes
  Memory Latency                   47 Nanoseconds
  Memory Threaded                  129257 MB/s
--------------------------------------------------------------------------------
2. Phoronix Test Suite
Phoronix Test Suite 测试将根据其已设定的集合进行选择性测试
目前暂定为以下集合
2.1. Server CPU Tests
测试项如下所示:
- 2.1.1. TTSIOD 3D Renderer 2.3b
- 2.1.2. OpenSSL
- 2.1.3. 7zip
- 2.1.4. Blender
- 2.1.5. asmfish
- 2.1.6. C-Ray
- 2.1.7. Stockfish
- 2.1.7. build-linux-kernel
- 2.1.8 build-php
- 2.1.9 PyBench
- 2.1.10 Zstd
- 2.1.11. NAMD
- 2.1.12 John The Ripper
- 2.1.13 Kvazaar
- 2.1.14 SVT-AV1
2.1.1. TTSIOD 3D Renderer 2.3b
- pts/ttsiod-renderer-1.7.0
TTSIOD 3D Renderer 2.3b:
    pts/ttsiod-renderer-1.7.0
    Phong Rendering With Soft-Shadow Mapping:
        63.0835
        59.2487
        61.1905
        62.7802
        62.3014
        61.6067

    Average: 61.7018 FPS
    Deviation: 2.26%
    Samples: 6
2.1.2. OpenSSL
OpenSSL 3.3:
    pts/openssl-3.3.0 [Algorithm: SHA256]

    Algorithm: SHA256:
        64426401710
        63273876540
        63447063990

    Average: 63715780747 byte/s
    Deviation: 0.98%

    Comparison of 1,839 OpenBenchmarking.org samples since 27 March 2024; median result: 18015118200 byte/s. Box plot of samples:
    [-######!###################*------------------------------*-*-*---*---------------------------------------*-------------*---*----*-----------*-----------------|   ]
                                ^ This Result (75th Percentile): 63715780747
                                      2 x AMD EPYC 7773X: 153330101813 ^       2 x AMD EPYC 9654: 245852932492 ^  2 x AMD EPYC 9754: 326197851362 ^
                                    Intel Xeon 6780E: 144342451485 ^                               2 x Intel Xeon 6980P: 300044534943 ^
                                     AMD EPYC 9655: 140634037292 ^                               2 x AMD EPYC 9734: 287211204448 ^
                                  AMD EPYC 9684X: 136057524698 ^                             2 x AMD EPYC 9655: 278325709969 ^

OpenSSL 3.3:
    pts/openssl-3.3.0 [Algorithm: SHA512]

    Algorithm: SHA512:
        21981688430
        21857188020
        21885085360

    Average: 21907987270 byte/s
    Deviation: 0.30%

    Comparison of 1,859 OpenBenchmarking.org samples since 27 March 2024; median result: 8116886677 byte/s. Box plot of samples:
    [--#####!###########*##*----*-------------*--*-------------------------------------*---*-----------*-*---------------------------------|                           *]
                        ^ This Result (73rd Percentile): 21907987270
                 2 x AMD EPYC 7773X: 48213245427 ^     2 x AMD EPYC 9575F: 89545411773 ^                                               2 x AMD EPYC 9965: 175821311425 ^
                  AMD EPYC 9575F: 45699414539 ^                          2 x AMD EPYC 9655: 109211229955 ^
                                ^ 2 x Intel Xeon Max 9468: 30269800294 2 x AMD EPYC 9754: 106799336326 ^
                           ^ AMD EPYC 8534P: 24384763404    2 x AMD EPYC 9734: 93963965184 ^

OpenSSL 3.3:
    pts/openssl-3.3.0 [Algorithm: RSA4096]

    Algorithm: RSA4096:
        13264.2
        13203.9
        13217.7

    Average: 13228.6 sign/s
    Deviation: 0.24%

    Comparison of 1,965 OpenBenchmarking.org samples since 27 March 2024; median result: 3510 sign/s. Box plot of samples:
    [###!##########*###---------------------------*--------*-*----*---------*---------------------------*-----*-----------*----*--------*----------|                    ]
                   ^ This Result (70th Percentile): 13229
                   2 x Intel Xeon Max 9468: 39714 ^ Intel Xeon 6980P: 61924 ^      AMD EPYC 9965: 85251 ^     2 x AMD EPYC 9754: 112694 ^
                                        2 x AMD EPYC 9374F: 53341 ^                                  2 x AMD EPYC 9655: 104914 ^
                              2 x Intel Xeon Max 9480: 48596 ^                                  2 x AMD EPYC 9734: 100501 ^
                                     AMD EPYC 9684X: 47053 ^                        2 x AMD EPYC 9575F: 90439 ^


    Algorithm: RSA4096:
        855640.1
        853794.6
        855953.7

    Average: 855129.5 verify/s
    Deviation: 0.14%

    Comparison of 2,072 OpenBenchmarking.org samples since 27 March 2024; median result: 176434 verify/s. Box plot of samples:
    [####!############-------*------------*----------*--*---------*----*-----------------------------*-*----------*-----------*--------|                              * ]
                             ^ This Result (81st Percentile): 855130
              2 x AMD EPYC 9374F: 1299436 ^  Intel Xeon 6980P: 2275511 ^ 2 x AMD EPYC 9575F: 3303918 ^                                     2 x AMD EPYC 9755: 5509621 ^
                                           AMD EPYC 9655: 2100783 ^                                2 x AMD EPYC 9655: 4139523 ^
                            2 x AMD EPYC 7773X: 1754315 ^                              2 x AMD EPYC 9754: 3730432 ^
                             AMD EPYC 9575F: 1655075 ^                          AMD EPYC 9965: 3351713 ^

OpenSSL 3.3:
    pts/openssl-3.3.0 [Algorithm: ChaCha20]

    Algorithm: ChaCha20:
        195363838090
        194680518250
        194610226790

    Average: 194884861043 byte/s
    Deviation: 0.21%

    Comparison of 1,909 OpenBenchmarking.org samples since 27 March 2024; median result: 92540074120 byte/s. Box plot of samples:
    [-*#*#!#*##*#*###-------------------------------------------------------------*--------------*--*---*---------------*----------------------------------|            ]
                 ^ This Result (67th Percentile): 194884861043
               ^ Intel Xeon 6766E: 177247657896      AMD EPYC 9845: 1217243871727 ^    2 x AMD EPYC 9655: 1796971779467 ^
            ^ AMD EPYC 4564P: 130554031693                                 AMD EPYC 9965: 1556306741301 ^
        ^ AMD EPYC 4364P: 68227046819                           2 x Intel Xeon 6980P: 1497912582696 ^
      ^ Intel Xeon 6369P: 34707164950                          2 x AMD EPYC 9575F: 1448070725056 ^

OpenSSL 3.3:
    pts/openssl-3.3.0 [Algorithm: AES-128-GCM]

    Algorithm: AES-128-GCM:
        224546335950
        223273561840
        223663998290

    Average: 223827965360 byte/s
    Deviation: 0.29%

    Comparison of 1,876 OpenBenchmarking.org samples since 27 March 2024; median result: 175901833350 byte/s. Box plot of samples:
    [#####!*############-----------*------*--*----*-----------------------------------*-------------*---------------------------*---*|                                 *]
           ^ This Result (56th Percentile): 223827965360
                 2 x AMD EPYC 9534: 1422195419210 ^ 2 x AMD EPYC 9575F: 2544766981572 ^                                               2 x AMD EPYC 9965: 5045935911512 ^
               AMD EPYC 9575F: 1287276493121 ^                                                     2 x AMD EPYC 9755: 3981162155838 ^
                                          ^ 2 x Intel Xeon Max 9468: 1192734005899          2 x Intel Xeon 6980P: 3857799018112 ^
                                   ^ AMD EPYC 9684X: 977267783611  2 x AMD EPYC 9655: 2984989956651 ^

OpenSSL 3.3:
    pts/openssl-3.3.0 [Algorithm: AES-256-GCM]

    Algorithm: AES-256-GCM:
        202293823620
        202430896540
        202620413540

    Average: 202448377900 byte/s
    Deviation: 0.08%

    Comparison of 1,965 OpenBenchmarking.org samples since 27 March 2024; median result: 139183056760 byte/s. Box plot of samples:
    [####!#*########*-------------*-------------*----*-------------------------------*--*------------*-------------*------------------|                               * ]
           ^ This Result (58th Percentile): 202448377900
                        AMD EPYC 9655: 1374498750099 ^  AMD EPYC 9965: 2278934527411 ^                                               2 x AMD EPYC 9965: 4548381171477 ^
               2 x AMD EPYC 9534: 1228090461180 ^                              2 x Intel Xeon 6980P: 3104107632618 ^
                                  ^ AMD EPYC 9684X: 840835667659    2 x AMD EPYC 9655: 2728219678129 ^
                    ^ AMD EPYC 8534P: 460256296220    2 x AMD EPYC 9575F: 2363420646628 ^

OpenSSL 3.3:
    pts/openssl-3.3.0 [Algorithm: ChaCha20-Poly1305]

    Algorithm: ChaCha20-Poly1305:
        126208536100
        126317264900
        126225508490

    Average: 126250436497 byte/s
    Deviation: 0.05%

    Comparison of 1,900 OpenBenchmarking.org samples since 27 March 2024; median result: 60300795267 byte/s. Box plot of samples:
    [-####!#####*####---*--*------------*-----------*-----------------------------*---------*------*-----*----------------*-----------------------------------|         ]
                ^ This Result (66th Percentile): 126250436497
                     Intel Xeon 6980P: 497125536396 ^ AMD EPYC 9845: 813869918202 ^      2 x AMD EPYC 9655: 1221845351539 ^
                                        ^ AMD EPYC 9684X: 376009731583      AMD EPYC 9965: 1053113704121 ^
                           ^ 2 x Intel Xeon 6766E: 239957620348   2 x AMD EPYC 9575F: 985487796613 ^
                        ^ AMD EPYC 8534P: 211139267794      2 x AMD EPYC 9754: 912796824759 ^

    Percentile Classification Of Current Benchmark Run
    PROCESSOR
        OpenSSL
            SHA256:             75th
            SHA512:             73rd
            RSA4096:            81st
            ChaCha20:           67th
            AES-128-GCM:        56th
            AES-256-GCM:        58th
            ChaCha20-Poly1305:  66th
                                OpenBenchmarking.org Percentile
2.1.3. 7zip
7-Zip Compression 25.00:
    pts/compress-7zip-1.12.0

    Test: Compression Rating:
        387922
        398225
        395065

    Average: 393737 MIPS
    Deviation: 1.34%

    Comparison of 749 OpenBenchmarking.org samples since 28 May; median result: 90769 MIPS. Box plot of samples:
    [|-#####!########-*----*---------*---------*-------------------*----------------------*-------------------------------|                                             ]
                                     ^ This Result (89th Percentile): 393737
                      ^ Intel Xeon Gold 6421N: 216023              AMD EPYC 9965: 1021461 ^
                                            AMD EPYC 9655P: 749975 ^
                         AMD EPYC 9754: 508412 ^
                           ^ 2 x Intel Xeon Max 9468: 269485


    Test: Decompression Rating:
        355461
        355089
        357799

    Average: 356116 MIPS
    Deviation: 0.41%

    Comparison of 730 OpenBenchmarking.org samples since 28 May; median result: 58191 MIPS. Box plot of samples:
    [|-##!########----------------*--------------------*----*----------*---------------*-----------------------------|                                       *          ]
                                  ^ This Result (87th Percentile): 356116
                                AMD EPYC 9655P: 604062 ^                                                                          2 x AMD EPYC 9965: 1803581 ^
                                                                 AMD EPYC 9965: 976213 ^
                                                 AMD EPYC 9754: 788455 ^
                                 2 x AMD EPYC 7773X: 664710 ^
2.1.4. Blender
Blender 4.5:
    pts/blender-4.5.0 [Blend File: BMW27 - Compute: CPU-Only]

    Blend File: BMW27 - Compute: CPU-Only:
        32.76
        32.51
        32.88

    Average: 32.72 Seconds
    Deviation: 0.58%

    Comparison of 273 OpenBenchmarking.org samples since 15 July; median result: 58.41 Seconds. Box plot of samples:
    [                   |-*------------------------------------*---------------*--------*---*---------------------------##*###########################!###*####*##*--*|*]
                                                                                                                          This Result (70th Percentile): 32.72 ^
                          ^ Intel Core i7-1165G7: 460          Intel Core Ultra 7 258V: 246 ^ Intel Xeon Silver 4216: 152 ^                    2 x AMD EPYC 9965: 4.99 ^
                                                             AMD Ryzen 7 PRO 6850U: 261 ^                                                      AMD EPYC 9655P: 13.62 ^
                                                    AMD Ryzen 7 PRO 5850U: 288 ^                                                   2 x Intel Xeon Max 9468: 22.32 ^
                                      Intel Core i5-1334U: 341 ^                                                                   AMD EPYC 4585PX: 47.72 ^

Blender 4.5:
    pts/blender-4.5.0 [Blend File: Junkshop - Compute: CPU-Only]

    Blend File: Junkshop - Compute: CPU-Only:
        49.88
        49.77
        50.38

    Average: 50.01 Seconds
    Deviation: 0.65%

    Comparison of 246 OpenBenchmarking.org samples since 15 July; median result: 70.84 Seconds. Box plot of samples:
    [                                                              |*-----------------------*-----*-----------------------------#*#####################*#!##*#*#####-*|*]
                                                                                                                         This Result (67th Percentile): 50.01 ^
                                                                     Intel Core Ultra 7 256V: 334 ^  Intel Xeon Silver 4216: 186 ^             2 x AMD EPYC 9965: 9.26 ^
                                                                 AMD Ryzen 7 PRO 6850U: 359 ^                                                  AMD EPYC 9655P: 18.69 ^
                                           Intel Core i5-1334U: 471 ^                                                                   AMD EPYC 4585PX: 63 ^
                                                                                                                                    AMD EPYC 4545P: 84 ^

Blender 4.5:
    pts/blender-4.5.0 [Blend File: Classroom - Compute: CPU-Only]

    Blend File: Classroom - Compute: CPU-Only:
        87.96
        87.9
        88.56

    Average: 88.14 Seconds
    Deviation: 0.41%

    Comparison of 234 OpenBenchmarking.org samples since 15 July; median result: 140 Seconds. Box plot of samples:
    [                                                     |-----------*-------------------------------*---*--*#*##########################*########!##*#####*###*---*-|*]
                                                                                                                       This Result (68th Percentile): 88.14 ^
                                         Intel Core Ultra 7 256V: 650 ^   Intel Xeon Silver 4216: 437 ^    AMD RYZEN AI MAX+ PRO 395: 206 ^   2 x AMD EPYC 9965: 11.22 ^
                                                                                     Intel Core i9-12900K: 381 ^                               AMD EPYC 9754: 32.77 ^
                                                                                    AMD Ryzen 7 5800X3D: 396 ^                   2 x Intel Xeon Max 9468: 55.95 ^
                                                                                  AMD Ryzen AI 9 365: 413 ^                      AMD EPYC 4585PX: 127 ^

Blender 4.5:
    pts/blender-4.5.0 [Blend File: Fishy Cat - Compute: CPU-Only]

    Blend File: Fishy Cat - Compute: CPU-Only:
        39.57
        39.73
        40.11

    Average: 39.80 Seconds
    Deviation: 0.70%

    Comparison of 227 OpenBenchmarking.org samples since 15 July; median result: 71.25 Seconds. Box plot of samples:
    [----------------------------------------------------------*-----------------------------------*#*###*###########################*####*##*!####*#######*#####--*--|*]
                                                                                                                      This Result (68th Percentile): 39.80 ^
                                       AMD Ryzen AI 5 340: 296 ^       Intel Xeon Silver 4216: 195 ^                  AMD Ryzen 9 7945HX: 77 ^ 2 x AMD EPYC 9965: 6.33 ^
                                                                                                      AMD RYZEN AI MAX+ PRO 395: 101 ^        AMD EPYC 9754: 16.87 ^
                                                                                AMD Ryzen 7 5800X3D: 177 ^                     AMD EPYC 4585PX: 61 ^
                                                                           Intel Core i9-12900K: 188 ^                 AMD EPYC 4545P: 85 ^

Blender 4.5:
    pts/blender-4.5.0 [Blend File: Barbershop - Compute: CPU-Only]

    Blend File: Barbershop - Compute: CPU-Only:
        326.72
        324.83
        325.3

    Average: 325.62 Seconds
    Deviation: 0.30%

    Comparison of 213 OpenBenchmarking.org samples since 15 July; median result: 491 Seconds. Box plot of samples:
    [ |--------------------------------------*-----------------*--------------*-----#*#######################################*######*######!#########*#*########*-*--|* ]
                                                                                                                  This Result (66th Percentile): 326 ^
                     AMD Ryzen 7 7840U: 2071 ^   Intel Xeon Silver 4216: 1514 ^                                 AMD EPYC 4545P: 617 ^        2 x AMD EPYC 9965: 45.62 ^
                                           AMD EPYC 7F32: 1774 ^                                                                               AMD EPYC 9754: 121 ^
                                                                                              AMD RYZEN AI MAX+ PRO 395: 741 ^          2 x AMD EPYC 7773X: 146 ^
                                                           AMD Ryzen 7 5800X3D: 1400 ^                                    2 x Intel Xeon Max 9468: 294 ^

Blender 4.5:
    pts/blender-4.5.0 [Blend File: Pabellon Barcelona - Compute: CPU-Only]

    Blend File: Pabellon Barcelona - Compute: CPU-Only:
        103.81
        104.91
        104.97

    Average: 104.56 Seconds
    Deviation: 0.62%

    Comparison of 227 OpenBenchmarking.org samples since 15 July; median result: 173 Seconds. Box plot of samples:
    [  |----------------------------------------------------------*--------------------*-----*---*######*###################################*###!###*#####*##*####-*--|*]
                                                                                                                       This Result (68th Percentile): 105 ^
                                          AMD Ryzen AI 5 340: 732 ^  Intel Xeon Silver 4216: 516 ^                      AMD EPYC 4545P: 209 ^ 2 x AMD EPYC 9965: 14.35 ^
                                                                          AMD EPYC 7F32: 542 ^                                                AMD EPYC 9754: 41.35 ^
                                                                              Intel Core i9-12900K: 461 ^                        2 x Intel Xeon Max 9468: 84 ^
                                                          Intel Core Ultra 7 155H: 582 ^                                       AMD EPYC 4585PX: 150 ^


    Percentile Classification Of Current Benchmark Run
    SYSTEM
        Blender
            BMW27 - CPU-Only:               70th
            Junkshop - CPU-Only:            67th
            Classroom - CPU-Only:           68th
            Fishy Cat - CPU-Only:           68th
            Barbershop - CPU-Only:          66th
            Pabellon Barcelona - CPU-Only:  68th
2.1.5. asmfish
asmFish 2018-07-23:
    pts/asmfish-1.1.2

    1024 Hash Memory, 26 Depth:
        152806160
        155782080
        148643908

    Average: 152410716 Nodes/second
    Deviation: 2.35%

    Comparison of 6,619 OpenBenchmarking.org samples since 3 December 2018; median result: 28078402 Nodes/second. Box plot of samples:
    [|--#########!###############-------------------------*-------------*------*----*-*--*------------------------------*-------------|*                 *   *  *       ]
                               This Result (91st Percentile): 152410716 ^
                                AMD EPYC 9374F: 122244590 ^ 2 x AMD EPYC 7702: 189552730 ^     AMD EPYC 9654: 261007934 ^          2 x AMD EPYC 9634: 349688292 ^
                                                         2 x AMD EPYC 75F3: 184238736 ^                                             AMD EPYC 9755: 343396399 ^
                                                       2 x AMD EPYC 7642: 179608194 ^                                           AMD EPYC 9965: 334489831 ^
                                                  2 x AMD EPYC 7H12: 169200731 ^                          2 x AMD EPYC 7763: 293092349 ^
2.1.6. C-Ray
- pts/c-ray-2.0.0 [Resolution: 5K - Rays Per Pixel: 16]
C-Ray 2.0:
    pts/c-ray-2.0.0 [Resolution: 5K - Rays Per Pixel: 16]

    Resolution: 5K - Rays Per Pixel: 16:
        107.123
        108.759
        109.203

    Average: 108.362 Seconds
    Deviation: 1.01%

    Comparison of 869 OpenBenchmarking.org samples since 28 April 2024; median result: 190 Seconds. Box plot of samples:
    [                                                          |---------------------*------------------------------------------------------*----############!#*#*#*#*-*]                                                                                                                                This Result (66th Percentile): 108 ^
                                                          Intel Core i7-1185G7: 1459 ^                          Intel Xeon Silver 4216: 501 ^ 2 x AMD EPYC 9734: 26.49 ^
                                                                                                                                                Intel Xeon 6766E: 66 ^
                                                                                                                                          2 x AMD EPYC 9124: 133 ^
                                                                                                                                          AMD EPYC 4585PX: 175 ^
2.1.7. Stockfish
Stockfish 17.1:
    pts/stockfish-1.7.0

    Chess Benchmark:
        58029261
        57635797
        58187944

    Average: 57951001 Nodes Per Second
    Deviation: 0.49%

    Comparison of 738 OpenBenchmarking.org samples since 27 March; median result: 17818736 Nodes Per Second. Box plot of samples:
    [-####!#######*-----*----------------------------*----*------------------------*----------*----------------------------------------------------------------------|  ]
                        ^ This Result (85th Percentile): 57951001
                  ^ AMD EPYC 4585PX: 38470779                        AMD EPYC 9965: 254847716 ^
                                                          AMD EPYC 9755: 223294876 ^
                            2 x AMD EPYC 7773X: 152025349 ^
                            AMD EPYC 9754: 139812934 ^
2.1.7. build-linux-kernel
Timed Linux Kernel Compilation 6.15:
    pts/build-linux-kernel-1.17.1 [Build: defconfig]

    Build: defconfig:
        48.495
        45.587
        45.71
        45.655
        45.716
        45.846

    Average: 46.168 Seconds
    Deviation: 2.48%
    Samples: 6

    Comparison of 810 OpenBenchmarking.org samples since 1 June; median result: 83.87 Seconds. Box plot of samples:
    [                          *   |-----------------------------------------------------------------------*----------------------------*----------#########*!*##*#*-|* ]
                                                                                                                             This Result (78th Percentile): 46.168 ^
                                                                                 Intel Core i7-1065G7: 484 ^    Intel Core i7-8700: 259 ^    2 x AMD EPYC 9755: 20.64 ^
                               ^ Intel Core i3-7020U: 1084                                                                                    AMD EPYC 4545P: 62 ^
                                                                                                                                           AMD EPYC 4345P: 87 ^
                                                                                                                                         AMD EPYC 7551: 104 ^


Timed Linux Kernel Compilation 6.15:
    pts/build-linux-kernel-1.17.1 [Build: allmodconfig]

    Build: allmodconfig:
        495.023
        492.697
        492.534

    Average: 493.418 Seconds
    Deviation: 0.28%

    Comparison of 430 OpenBenchmarking.org samples since 1 June; median result: 814 Seconds. Box plot of samples:
    [------------------------------------------------------------------*-*--------------------------------*-------#######*##########*######*######!#########*#*--*-*|*  ]                                                                                                                         This Result (71st Percentile): 493 ^
                                             AMD Ryzen 7 PRO 6850U: 3506 ^            AMD EPYC 7F32: 2307 ^            AMD EPYC 7601: 1088 ^  2 x AMD EPYC 9755: 141 ^
                                          Intel Xeon E5-2630L v4: 3584 ^                                                                       AMD EPYC 9655P: 231 ^
                                                                                                          AMD Ryzen 7 7800X3D: 1371 ^    2 x AMD EPYC 7773X: 305 ^
                                                                                                AMD Ryzen 7 7840HS: 1777 ^                 AMD EPYC 9754: 412 ^
2.1.8 build-php
- Timed PHP Compilation 8.3.4
Timed PHP Compilation 8.3.4:
    pts/build-php-1.7.0

    Time To Compile:
        54.831
        54.824
        54.797

    Average: 54.817 Seconds
    Deviation: 0.03%

    Comparison of 1,096 OpenBenchmarking.org samples since 31 December 2020; median result: 52.65 Seconds. Box plot of samples:
    [             |-----------------------------------------------------------------------------------------------------*---------------------------------*----*#*#*#|* ]
                                                                                                                             This Result (42nd Percentile): 54.817 ^
                                                                                                  ARMv8 Cortex-A72: 480 ^                       AMD EPYC 9655P: 32.25 ^
                                                                                                                                               AMD EPYC 7F32: 83 ^
                                                                                                                               Intel Xeon E3-1280 v5: 149 ^
                                                                                                                                   Intel Core Ultra 7 256V: 95 ^
2.1.9 PyBench
PyBench 2018-02-16:
    pts/pybench-1.1.3

    Total For Average Test Times:
        1291
        1295
        1302

    Average: 1296 Milliseconds
    Deviation: 0.43%

    Comparison of 9,242 OpenBenchmarking.org samples since 26 February 2011; median result: 1177 Milliseconds. Box plot of samples:
    [                                   |------------*-------------------------------------------*-----*---------------------------------------*---------####*#*##*-*|* ]
                                                                                                                           This Result (41st Percentile): 1296 ^
                                                                                           Ky X1: 8406 ^       ZHAOXIN KaiXian KX-6640MA: 3377 ^ AMD EPYC 4585PX: 409 ^
                                                                               ARMv7 rev 1: 9157 ^                                               AMD EPYC 9755: 583 ^
                    Rockchip ARMv8 Cortex-A53: 14791 ^                                                                                     2 x AMD EPYC 9554: 845 ^
                                                                                                                              2 x Intel Xeon Gold 6130: 1476 ^
2.1.10 Zstd
Zstd Compression 1.5.4:
    pts/compress-zstd-1.6.0 [Compression Level: 19, Long Mode]

    Compression Level: 19, Long Mode - Compression Speed:
        6.87
        6.85
        6.88

    Average: 6.87 MB/s
    Deviation: 0.22%

    Comparison of 1,989 OpenBenchmarking.org samples since 10 February 2023; median result: 7.46 MB/s. Box plot of samples:
    [          *      |--------------------*-*----------------------###########*#*#####!##########*##*##*#*#############-------*----*---*-----------*--*--------|       ]
                                             This Result (42nd Percentile): 6.87 ^
                   Intel Core i5-6260U: 3.66 ^         Intel Xeon E-2336: 6.76 ^ 2 x AMD EPYC 7773X: 9.16 ^  AMD EPYC 9655: 11 ^ AMD EPYC 4484PX: 13.2 ^
                                           ^ Rockchip ARMv8 Cortex-A76: 3.47          AMD EPYC 4124P: 9 ^                     AMD EPYC 4584PX: 12.9 ^
               ^ rv64imafdcvsu: 0.99                                         2 x AMD EPYC 9654: 8.72 ^             AMD EPYC 9575F: 11.8 ^
                                                                             AMD EPYC 9684X: 8.47 ^            AMD EPYC 4464P: 11.5 ^


    Compression Level: 19, Long Mode - Decompression Speed:
        1030.2
        1029.1
        1027.8

    Average: 1029.0 MB/s
    Deviation: 0.12%

    Comparison of 1,959 OpenBenchmarking.org samples since 10 February 2023; median result: 1365 MB/s. Box plot of samples:
    [   *             |------------------------------------------*------#######*#####*#*###*##*#########!###################*######*###*-----------*------------*----|  ]
                                           This Result (31st Percentile): 1029 ^
        ^ rv64imafdcvsu: 49       2 x Intel Xeon Gold 5220R: 831 ^   2 x AMD EPYC 7573X: 1225 ^    Intel Xeon E-2388G: 1640 ^              AMD EPYC 4545P: 2126 ^
                                                                      AMD EPYC 7773X: 1191 ^                              2 x AMD EPYC 9575F: 1959 ^
                                                                Intel Xeon 6980P: 1135 ^                           AMD EPYC 9655: 1784 ^
                                                             2 x AMD EPYC 9754: 1107 ^                        AMD EPYC 9655P: 1728 ^
2.1.11. NAMD
NAMD 3.0:
    pts/namd-1.4.0 [Input: ATPase with 327,506 Atoms]
    Test 1 of 2

    Input: ATPase with 327,506 Atoms:
        2.8228811454123
        2.829166442691
        2.8359220575182

    Average: 2.82932 ns/day
    Deviation: 0.23%

    Comparison of 1,003 OpenBenchmarking.org samples since 23 September 2024; median result: 2.23 ns/day. Box plot of samples:
    [|--#######!##*#######-----------------------*----------------*-*-----*---*------------------------*-------------------------*-------*-------*-----|              * ]
                  ^ This Result (57th Percentile): 2.82932
                        2 x AMD EPYC 9534: 8.858 ^ 2 x AMD EPYC 9575F: 14.637 ^  AMD EPYC 9965: 19.745 ^                                     2 x AMD EPYC 9755: 32.18 ^
                                                    AMD EPYC 9755: 13.933 ^                                             2 x AMD EPYC 9745: 28.02 ^
                                             AMD EPYC 9575F: 12.669 ^                                           2 x AMD EPYC 9845: 26.42 ^
                                        2 x AMD EPYC 9455: 12.365 ^                                     2 x AMD EPYC 9645: 24.88 ^

NAMD 3.0:
    pts/namd-1.4.0 [Input: STMV with 1,066,628 Atoms]

    Input: STMV with 1,066,628 Atoms:
        0.7384706273308
        0.75371013815507
        0.74673676035724

    Average: 0.74631 ns/day
    Deviation: 1.02%

    Comparison of 1,010 OpenBenchmarking.org samples since 23 September 2024; median result: 0.7 ns/day. Box plot of samples:
    [|--*#*#*#*#*################-------------------------------------*----------*----*--*--------*--------------------------*-------*-------*--------*-------------|*  ]
                ^ This Result (50th Percentile): 0.74631
              ^ AMD EPYC 4464P: 0.6167      Intel Xeon 6980P: 3.97836 ^ 2 x AMD EPYC 9684X: 5.673 ^  2 x AMD EPYC 9645: 7.27 ^              2 x AMD EPYC 9755: 9.687 ^
            ^ AMD EPYC 4364P: 0.50048                               AMD EPYC 9965: 5.127 ^                                   2 x AMD EPYC 9965: 8.808 ^
          ^ AMD EPYC 7601: 0.36521                          2 x AMD EPYC 9455: 4.9295 ^                             2 x AMD EPYC 9745: 8.268 ^
        ^ Intel Xeon 6369P: 0.21143                   2 x AMD EPYC 9535: 4.61937 ^                          2 x AMD EPYC 9845: 7.778 ^
2.1.12 John The Ripper
John The Ripper 2025.05.24:
    pts/john-the-ripper-1.9.0 [Test: bcrypt]

    Test: bcrypt:
        80229
        76313
        79948
        77247

    Average: 78434 Real C/S
    Deviation: 2.49%
    Samples: 4

    Comparison of 324 OpenBenchmarking.org samples since 25 May; median result: 43291 Real C/S. Box plot of samples:
    [|-*######!##*####*######---*-----------------------*---*------------*---------------------*---------------------------------------------*-----------|              ]
                      ^ This Result (67th Percentile): 78434
       ^ AMD EPYC 7F32: 12567     AMD EPYC 9754: 219996 ^                                                          2 x AMD EPYC 9755: 585032 ^
                                ^ ARMv8 Neoverse-V2: 120078              AMD EPYC 9965: 388047 ^
                 ^ AMD Ryzen 9 9950X3D: 56868      AMD EPYC 9755: 294710 ^
                                     AMD EPYC 9655P: 237057 ^

John The Ripper 2025.05.24:
    pts/john-the-ripper-1.9.0 [Test: WPA PSK]

    Test: WPA PSK:
        167551
        157318
        165777
        160100
        163566
        147816
        151688
        165559
        165832
        160509
        166050
        158242
        159774
        166242
        161274

    Average: 161153 Real C/S
    Deviation: 3.53%
    Samples: 15

    Comparison of 326 OpenBenchmarking.org samples since 25 May; median result: 141725 Real C/S. Box plot of samples:
    [#*####!*######*#---------*----------------------*------*---------------------------*-------------------------*-------------------------------------*-|             ]
            ^ This Result (52nd Percentile): 161153
      ^ AMD EPYC 7601: 40428 AMD EPYC 9655P: 1021250 ^                                                                       2 x AMD EPYC 9965: 3090471 ^
                              ^ AMD Ryzen Threadripper 7980X: 536540                   2 x AMD EPYC 9755: 2306000 ^
                   ^ AMD Ryzen Threadripper 7970X: 316906        AMD EPYC 9965: 1758714 ^
                                     AMD EPYC 9755: 1175000 ^

John The Ripper 2025.05.24:
    pts/john-the-ripper-1.9.0 [Test: Blowfish]

    Test: Blowfish:
        79680
        79538
        79372

    Average: 79530 Real C/S
    Deviation: 0.19%

    Comparison of 334 OpenBenchmarking.org samples since 25 May; median result: 42939 Real C/S. Box plot of samples:
    [|-#######!########*###------------------*----------*---*-------------*--------------------*-----------------------------------------------------------------|      ]
                       ^ This Result (68th Percentile): 79530
                  2 x AMD EPYC 7773X: 174149 ^                           AMD EPYC 9965: 387821 ^
                                                    AMD EPYC 9755: 297882 ^
                                     AMD EPYC 9655P: 237571 ^
                                  AMD EPYC 9754: 221224 ^

John The Ripper 2025.05.24:
    pts/john-the-ripper-1.9.0 [Test: HMAC-SHA512]

    Test: HMAC-SHA512:
        97218000
        90107000
        113321000
        114969000
        113216000
        113848000
        115052000
        114423000
        99697000
        94784000
        113756000
        111149000
        103179000
        107727000
        112143000

    Average: 107639267 Real C/S
    Deviation: 7.82%
    Samples: 15

    Comparison of 305 OpenBenchmarking.org samples since 25 May; median result: 84195867 Real C/S. Box plot of samples:
    [    |-------#*#*####*#########*##!########*###########################*##############################-----------*----------*-*------------*---------------------|* ]
                                               ^ This Result (57th Percentile): 107639267
                  ^ AMD EPYC 7601: 34731084       AMD EPYC 9755: 177413600 ^            2 x AMD EPYC 9755: 281530333 ^                      AMD EPYC 9655P: 403634500 ^
                                   ^ Intel Xeon Silver 4216: 78239000                                                 AMD EPYC 9965: 346853143 ^
                         ^ 2 x Intel Xeon E5-2680 v4: 51676542                                         AMD EPYC 4585PX: 314068641 ^
                    ^ Intel Xeon 6369P: 40376400                                                       AMD EPYC 9754: 309277000 ^

John The Ripper 2025.05.24:
    pts/john-the-ripper-1.9.0 [Test: MD5]

    Test: MD5:
        4623000
        3821000
        4114000
        3565000
        4480000
        4469000
        3973000
        4632000
        4593000
        4635000
        4163000
        4479000
        4649000
        4464000
        4660000

    Average: 4354667 Real C/S
    Deviation: 7.93%
    Samples: 15

    Comparison of 321 OpenBenchmarking.org samples since 25 May; median result: 3120000 Real C/S. Box plot of samples:
    [|######!##*####*####*#----------------------*------*---*------------------------------------*--------------------------------*-------------------------------|     ]
               ^ This Result (60th Percentile): 4354667
                    ^ AMD EPYC 4585PX: 6123154   ^ AMD Ryzen Threadripper 9980X: 17253949             2 x AMD EPYC 9755: 48066000 ^
                         ^ AMD Ryzen Threadripper 7970X: 8127037         AMD EPYC 9965: 35604000 ^
                                   AMD EPYC 9655P: 21475000 ^
                                AMD EPYC 9754: 19661000 ^

    Percentile Classification Of Current Benchmark Run
    PROCESSOR
        John The Ripper
            bcrypt:        67th
            WPA PSK:       52nd
            Blowfish:      68th
            HMAC-SHA512:   57th
            MD5:           60th
                           OpenBenchmarking.org Percentile
2.1.13 Kvazaar
Kvazaar 2.2:
    pts/kvazaar-1.2.0 [Video Input: Bosphorus 4K - Video Preset: Medium]

    Video Input: Bosphorus 4K - Video Preset: Medium:
        21.78
        21.74
        21.71

    Average: 21.74 Frames Per Second
    Deviation: 0.16%

    Comparison of 2,366 OpenBenchmarking.org samples since 4 January 2023; median result: 15.38 Frames Per Second. Box plot of samples:
    [   |------------######*##*##*#!##*##########*#######-----------*-----------------*-------*-----*-*-------------------------------*-------*------------*-*--|  *    ]
                                                 ^ This Result (68th Percentile): 21.74
                AMD EPYC 4465P: 16.39 ^ 2 x Intel Xeon 6980P: 31.02 ^            AMD EPYC 9845: 47.96 ^     2 x AMD EPYC 9575F: 63.26 ^   2 x AMD EPYC 9755: 77.75 ^
                                 ^ Intel Xeon Gold 6444Y: 14.36                AMD EPYC 9655: 46.79 ^                               2 x AMD EPYC 9965: 74.83 ^
                              ^ AMD EPYC 4364P: 12.62                   AMD EPYC 9575F: 43.84 ^                                   2 x AMD EPYC 9655: 73.95 ^
                           ^ AMD EPYC 7601: 11.44                AMD EPYC 9654: 40.06 ^                                  AMD EPYC 9965: 67.38 ^

Kvazaar 2.2:
    pts/kvazaar-1.2.0 [Video Input: Bosphorus 1080p - Video Preset: Medium]

    Video Input: Bosphorus 1080p - Video Preset: Medium:
        97.36
        97.91
        96.86

    Average: 97.38 Frames Per Second
    Deviation: 0.54%

    Comparison of 1,173 OpenBenchmarking.org samples since 4 January 2023; median result: 47.22 Frames Per Second. Box plot of samples:
    [    |-----------------------##*####*##*#######!###*#################------------*----*-*---------*---*---------------------------------------*--|                  ]
                                                                 This Result (91st Percentile): 97.38 ^
                                  AMD EPYC 7402P: 50.9 ^         AMD EPYC 4584PX: 81 ^                                     2 x AMD EPYC 9654: 142 ^
                       AMD EPYC 7F32: 39.2 ^                                      2 x AMD EPYC 7773X: 102 ^
                  AMD EPYC 4124P: 36.07 ^                                AMD EPYC 4564P: 88 ^
                                   ^ 2 x Intel Xeon Gold 6430: 31.32   AMD EPYC 7713P: 86 ^
2.1.14 SVT-AV1
- Encoder Mode: Preset 13 - Input: Beauty 4K 10-bit
SVT-AV1 3.0:
    pts/svt-av1-2.16.0 [Encoder Mode: Preset 13 - Input: Beauty 4K 10-bit]

    Encoder Mode: Preset 13 - Input: Beauty 4K 10-bit:
        9.138
        8.93
        9.384

    Average: 9.151 Frames Per Second
    Deviation: 2.48%

    Comparison of 153 OpenBenchmarking.org samples since 31 January; median result: 11.47 Frames Per Second. Box plot of samples:
    [                    |------------------*-----*---------*-----------#############*#########*#####*###!######*##############*###########*#------------------|        ]
                                                This Result (34th Percentile): 9.151 ^
                                   AMD Ryzen AI 9 365: 6.32 ^  2 x Intel Xeon Max 9468: 10.359 ^                    AMD EPYC 9655P: 15.373 ^
                         AMD Ryzen 5 7540U: 5.214 ^                                                  2 x AMD EPYC 9755: 14.018 ^
             Intel Core Ultra 7 155H: 4.527 ^                                         2 x AMD EPYC 9965: 12.244 ^
                                                                                AMD EPYC 9754: 11.01 ^
2.2. Server
测试项如下所示:
- 2.2.1. InfluxDB
- 2.2.2. Rustls
2.2.1. InfluxDB
- pts/influxdb-1.0.2 [Concurrent Streams: 1024 - Batch Size: 10000 - Tags: 2,5000,1 - Points Per Series: 10000]
Concurrent Streams: 1024 - Batch Size: 10000 - Tags: 2,5000,1 - Points Per Series: 10000:
        1155115.2
        1156511.6
        1155947.2

    Average: 1155858.0 val/sec
    Deviation: 0.06%

    Comparison of 466 OpenBenchmarking.org samples since 23 September 2020; median result: 1224531 val/sec. Box plot of samples:
    [------------*-----------------------------------------------------##########*###*##*####!#*##########*#########-*---------------------*------*----*-------*------|          ]
                                                 This Result (45th Percentile): 1155858 ^
                 ^ Intel Core i5-7600K: 172730    Intel Xeon E3-1275 v6: 1061235 ^       Intel Xeon E-2288G: 1556567 ^           Intel Core i5-12600K: 2122061 ^
                                                                                   AMD EPYC 7F72: 1405632 ^                 AMD Ryzen 9 5950X: 2010471 ^
                                                            2 x Intel Xeon Gold 5220R: 1243398 ^                    Intel Core i9-11900K: 1948138 ^
                                                     Intel Xeon E5-2687W v3: 1108748 ^                       Intel Core i9-10900K: 1852465 ^
2.2.2. Rustls
- Benchmark: handshake - Suite: TLS13_AES_256_GCM_SHA384
Rustls 0.23.17:
    pts/rustls-1.0.0 [Benchmark: handshake - Suite: TLS13_AES_256_GCM_SHA384]

    Benchmark: handshake - Suite: TLS13_AES_256_GCM_SHA384:
        213944.93
        214188.39
        213792.63

    Average: 213975.32 handshakes/s
    Deviation: 0.09%

    Comparison of 57 OpenBenchmarking.org samples since 16 November 2024 to 30 December; median result: 250770 handshakes/s. Box plot of samples:
    [                      |------------*--------------*----*--###########################*########*################!#############################*#########*--------*--------*| ]                                                             This Result (47th Percentile): 213975 ^
                                 AMD Ryzen 7 7840HS: 126942 ^ AMD Ryzen 7 9800X3D: 192422 ^                                                            AMD EPYC 9655P: 382768 ^
                         AMD Ryzen AI 9 HX 370: 114185 ^                                                                2 x AMD EPYC 9535: 318722 ^
                                        ^ Intel Core Ultra 7 155H: 82006                                                                   ARMv8 Neoverse-V2: 361714 ^
                                                                                                                       AMD Ryzen Threadripper 7980X: 341584 ^
2.3. Large Language Models
此部分测试系统BIOS已做如下调整:
- 逻辑处理器 / SMT (超线程): 设置为 Disabled (禁用)
- CPU C-States (CPU C状态): 设置为 Disabled (禁用)
- CPU电源管理 (CPU Power Management): 设置为 Maximum Performance (最大性能)
- NUMA Nodes Per Socket (NPS): 设置为 NPS4
测试项如下所示:
- 2.3.1. Llama.cpp
- 2.3.2. Llamafile
2.3.1. Llama.cpp
Llama.cpp b4397:
    pts/llama-cpp-2.1.1 [Backend: CPU BLAS - Model: Llama-3.1-Tulu-3-8B-Q8_0 - Test: Text Generation 128]

    Backend: CPU BLAS - Model: Llama-3.1-Tulu-3-8B-Q8_0 - Test: Text Generation 128:
        3.25
        3.21
        3.23

    Average: 3.23 Tokens Per Second
    Deviation: 0.62%

    Comparison of 567 OpenBenchmarking.org samples since 6 December 2024; median result: 8.98 Tokens Per Second. Box plot of samples:
    [      * |-*-----------*#*##*!#################----------------*------------------------------------*--*-------------*------------------------------*|          *   ]
               ^ This Result (2nd Percentile): 3.23
           ^ ARMv8 Neoverse-N1: 2         2 x AMD EPYC 9654: 19.41 ^          2 x AMD EPYC 9175F: 30.69 ^                                     AMD EPYC 9575F: 49.07 ^
                                ^ Intel Xeon 6369P: 8.58                                                                          AMD EPYC 9655P: 45.35 ^
                             ^ AMD EPYC 4465P: 7.52                                             2 x AMD EPYC 9255: 35.76 ^
                           ^ AMD EPYC 4545P: 7.01                                     AMD EPYC 9845: 31.57 ^

Llama.cpp b4397:
    pts/llama-cpp-2.1.1 [Backend: CPU BLAS - Model: Llama-3.1-Tulu-3-8B-Q8_0 - Test: Prompt Processing 2048]

    Backend: CPU BLAS - Model: Llama-3.1-Tulu-3-8B-Q8_0 - Test: Prompt Processing 2048:
        27.35
        26.18
        24.92
        21.77
        25.92
        23.86

    Average: 25.00 Tokens Per Second
    Deviation: 7.90%
    Samples: 6

    Comparison of 452 OpenBenchmarking.org samples since 6 December 2024; median result: 78.28 Tokens Per Second. Box plot of samples:
    [                  |-----*--*---*--------*----*------######################*###*!###*###########*#*------------------------*---*------*-----------| *             * ]
                             ^ This Result (3rd Percentile): 25.00
                          Intel Xeon 6369P: 45.28 ^     2 x AMD EPYC 9684X: 74 ^  AMD EPYC 4585PX: 96 ^     AMD EPYC 9965: 121 ^               2 x AMD EPYC 9365: 159 ^
                       AMD EPYC 4244P: 40.61 ^                                   AMD EPYC 4565P: 94 ^                            2 x AMD EPYC 9455: 145 ^
              AMD EPYC 4124P: 31.09 ^                             2 x AMD EPYC 9255: 82 ^                             AMD EPYC 9575F: 132 ^
                                ^ AMD EPYC 7601: 27.86       2 x AMD EPYC 9654: 78 ^                            AMD EPYC 9845: 125 ^

Llama.cpp b4397:
    pts/llama-cpp-2.1.1 [Backend: CPU BLAS - Model: Mistral-7B-Instruct-v0.3-Q8_0 - Test: Text Generation 128]

    Backend: CPU BLAS - Model: Mistral-7B-Instruct-v0.3-Q8_0 - Test: Text Generation 128:
        3.27
        3.45
        3.35
        3.35

    Average: 3.36 Tokens Per Second
    Deviation: 2.20%
    Samples: 4

    Comparison of 523 OpenBenchmarking.org samples since 6 December 2024; median result: 9.44 Tokens Per Second. Box plot of samples:
    [     *  |*----------*-#*###*!########################--------*--------------------------------*-----*-------------*------------------------------*|           *    ]
              ^ This Result (2nd Percentile): 3.36
          ^ ARMv8 Neoverse-N1: 2         2 x AMD EPYC 9654: 20.21 ^      2 x AMD EPYC 9684X: 30.94 ^                                         AMD EPYC 9575F: 51.76 ^
                                ^ Intel Xeon 6369P: 9.09                                                                        AMD EPYC 9655P: 47.38 ^
                            ^ AMD EPYC 4465P: 7.92                                            2 x AMD EPYC 9255: 37.23 ^
                         ^ AMD EPYC 4245P: 6.97                                     AMD EPYC 9845: 32.74 ^

Llama.cpp b4397:
    pts/llama-cpp-2.1.1 [Backend: CPU BLAS - Model: Mistral-7B-Instruct-v0.3-Q8_0 - Test: Prompt Processing 2048]
    Test 4 of 6

    Backend: CPU BLAS - Model: Mistral-7B-Instruct-v0.3-Q8_0 - Test: Prompt Processing 2048:
        26.14
        26.65
        22.44
        27.71
        31.43
        24.46
        27.61
        25.31
        25.82

    Average: 26.40 Tokens Per Second
    Deviation: 9.43%
    Samples: 9

    Comparison of 471 OpenBenchmarking.org samples since 6 December 2024; median result: 79.03 Tokens Per Second. Box plot of samples:
    [                   |--------*----*---------*-----*------*#*##########################!*############*#*###*--*---------------------*----*-----*-----------|  *   *  ]
                                 ^ This Result (3rd Percentile): 26.40
                AMD EPYC 4124P: 31.11 ^  AMD EPYC 4364P: 54.49 ^     2 x AMD EPYC 9654: 80 ^  AMD EPYC 9755: 100 ^  AMD EPYC 9965: 120 ^      2 x AMD EPYC 9365: 148 ^
                                       AMD EPYC 4464P: 52.69 ^                            AMD EPYC 4585PX: 97 ^                           2 x AMD EPYC 9455: 144 ^
                              Intel Xeon 6369P: 45.55 ^                                AMD EPYC 4565P: 94 ^                   AMD EPYC 9575F: 131 ^
                          AMD EPYC 4244P: 40.49 ^                                 2 x AMD EPYC 9755: 92 ^                AMD EPYC 9845: 125 ^

Llama.cpp b4397:
    pts/llama-cpp-2.1.1 [Backend: CPU BLAS - Model: granite-3.0-3b-a800m-instruct-Q8_0 - Test: Text Generation 128]

    Backend: CPU BLAS - Model: granite-3.0-3b-a800m-instruct-Q8_0 - Test: Text Generation 128:
        21.69
        22.15
        20.96
        20.83
        20.57
        20.59
        21.3
        21.5
        21.86
        20
        20.8
        21.83
        20.8
        21.81
        22.01

    Average: 21.25 Tokens Per Second
    Deviation: 3.03%
    Samples: 15

    Comparison of 561 OpenBenchmarking.org samples since 6 December 2024; median result: 54.33 Tokens Per Second. Box plot of samples:
    [          |-----------------*-------------------*---*----------######*#*#*!##################----*---------------------*-*------*--------------------|           * ]
                                 ^ This Result (3rd Percentile): 21.25
                      Intel Core Ultra 7 258V: 35.64 ^ AMD EPYC 4484PX: 53.82 ^ 2 x AMD EPYC 9365: 71 ^                                           AMD EPYC 9575F: 117 ^
                                                      AMD EPYC 4464P: 52.24 ^                                     AMD EPYC 9655P: 93 ^
                                                    AMD EPYC 4364P: 50.88 ^                             2 x AMD EPYC 9015: 88 ^
                                2 x AMD EPYC 9755: 38.11 ^                                            2 x AMD EPYC 9255: 87 ^


Llama.cpp b4397:
    pts/llama-cpp-2.1.1 [Backend: CPU BLAS - Model: granite-3.0-3b-a800m-instruct-Q8_0 - Test: Prompt Processing 2048]

    Backend: CPU BLAS - Model: granite-3.0-3b-a800m-instruct-Q8_0 - Test: Prompt Processing 2048:
        153.39
        138.04
        141.47
        130.97
        123.98
        119.65
        142.27
        152.08
        153.82
        143.03
        151.85
        142.21
        141.8
        137.9
        123.94

    Average: 139.76 Tokens Per Second
    Deviation: 7.88%
    Samples: 15

    Comparison of 457 OpenBenchmarking.org samples since 6 December 2024; median result: 260 Tokens Per Second. Box plot of samples:
    [                    |-----*----*--------*------*--*-------########*#########*##*#*######*####!############################*###*-*---*---------------*-----------|  ]
                    This Result (16th Percentile): 140 ^
                         AMD EPYC 4124P: 113 ^     AMD EPYC 4344P: 184 ^ AMD EPYC 4345P: 246 ^          2 x AMD EPYC 9255: 339 ^  2 x AMD EPYC 9365: 412 ^
                  AMD EPYC 7601: 87 ^                              AMD EPYC 9754: 225 ^                          2 x AMD EPYC 9175F: 367 ^
                             ARMv8 Neoverse-N1: 133 ^        2 x AMD EPYC 9755: 221 ^                            AMD EPYC 4565P: 356 ^
                               ^ Intel Core Ultra 7 155H: 75 AMD EPYC 4464P: 212 ^                             AMD EPYC 9655P: 351 ^

    Percentile Classification Of Current Benchmark Run
    SYSTEM
        Llama.cpp
            CPU BLAS - Llama-3.1-Tulu-3-8B-Q8_0 - T.G.1:            2nd
            CPU BLAS - Llama-3.1-Tulu-3-8B-Q8_0 - P.P.2:            3rd
            CPU BLAS - Mistral-7B-Instruct-v0.3-Q8_0 - T.G.1:       2nd
            CPU BLAS - Mistral-7B-Instruct-v0.3-Q8_0 - P.P.2:       3rd
            CPU BLAS - granite-3.0-3b-a800m-instruct-Q8_0 - T.G.1:  3rd
            CPU BLAS - granite-3.0-3b-a800m-instruct-Q8_0 - P.P.2:  16th
                                                                    OpenBenchmarking.org Percentile
2.3.2. Llamafile
Llamafile 0.8.16:
    pts/llamafile-1.3.0 [Model: mistral-7b-instruct-v0.2.Q5_K_M - Test: Text Generation 128]

    Model: mistral-7b-instruct-v0.2.Q5_K_M - Test: Text Generation 128:
        17.13
        16.06
        16.14
        15.87
        17.17
        17.03
        16.64
        16.35
        16.79
        15.66
        16.19
        16.35
        16.19
        16.63
        15.24

    Average: 16.36 Tokens Per Second
    Deviation: 3.35%
    Samples: 15

    Comparison of 94 OpenBenchmarking.org samples since 5 December 2024 to 20 June; median result: 13.85 Tokens Per Second. Box plot of samples:
    [                     |--#*######!*####*################*#######################################################----*--*-----*---*-----------------------------*-|  ]
                                           ^ This Result (56th Percentile): 16.36
                              ^ AMD EPYC 4464P: 10.91                                          2 x AMD EPYC 9455: 48.83 ^                     AMD EPYC 9575F: 67.1 ^
                        AMD Ryzen Threadripper 7980X: 23.55 ^                                                  AMD EPYC 9655P: 54.33 ^
             AMD Ryzen 9 9950X: 14.24 ^                                                                2 x AMD EPYC 9475F: 52.78 ^
                                                                                                 2 x AMD EPYC 9275F: 50.18 ^

Llamafile 0.8.16:
    pts/llamafile-1.3.0 [Model: wizardcoder-python-34b-v1.0.Q6_K - Test: Text Generation 128]

    Model: wizardcoder-python-34b-v1.0.Q6_K - Test: Text Generation 128:
        3.08
        3.18
        3.24
        3.29
        3.31
        3.33
        3.33
        3.38
        3.32
        3.34
        3.35
        3.31

    Average: 3.29 Tokens Per Second
    Deviation: 2.56%
    Samples: 12

    Comparison of 89 OpenBenchmarking.org samples since 5 December 2024 to 20 June; median result: 2.67 Tokens Per Second. Box plot of samples:
    [                 |-#*#####!#####*###################################################################*###################--------*-------*--------*--------------|  ]
                                     ^ This Result (53rd Percentile): 3.29
                         ^ AMD EPYC 4484PX: 2.05                                                                                AMD EPYC 9655P: 14.39 ^
                                                                                                                   2 x AMD EPYC 9475F: 13.47 ^
                                                                                                            2 x AMD EPYC 9455: 12.69 ^
                                                                                2 x AMD EPYC 9375F: 9.95 ^

Llamafile 0.8.16:
    pts/llamafile-1.3.0 [Model: mistral-7b-instruct-v0.2.Q5_K_M - Test: Prompt Processing 2048]

    Model: mistral-7b-instruct-v0.2.Q5_K_M - Test: Prompt Processing 2048:
        32768
        32768
        32768

    Average: 32768 Tokens Per Second
    Deviation: 0.00%

    Comparison of 65 OpenBenchmarking.org samples since 5 December 2024 to 20 June; median result: 32768 Tokens Per Second. Box plot of samples:
    [                                                                                                                                                                #* ]
                                                                                                                                                   This Result: 32768 ^

Llamafile 0.8.16:
    pts/llamafile-1.3.0 [Model: wizardcoder-python-34b-v1.0.Q6_K - Test: Prompt Processing 2048]

    Model: wizardcoder-python-34b-v1.0.Q6_K - Test: Prompt Processing 2048:
        12288
        12288
        12288

    Average: 12288 Tokens Per Second
    Deviation: 0.00%

    Comparison of 62 OpenBenchmarking.org samples since 5 December 2024 to 20 June; median result: 12288 Tokens Per Second. Box plot of samples:
    [                                                                                                                                                                #* ]
                                                                                                                                                   This Result: 12288 ^

    Percentile Classification Of Current Benchmark Run
    SYSTEM
        Llamafile
            mistral-7b-instruct-v0.2.Q5_K_M - T.G.1:   56th
            wizardcoder-python-34b-v1.0.Q6_K - T.G.1:  53rd
                                                       OpenBenchmarking.org Percentile
Thanks & Copy
PassMark Software - PC Benchmark and Test Software
Benchmark & PC test software. Computer forensics and loopback test plugs for burn in testing.


OpenBenchmarking.org - Cross-Platform, Open-Source Automated Benchmarking Platform